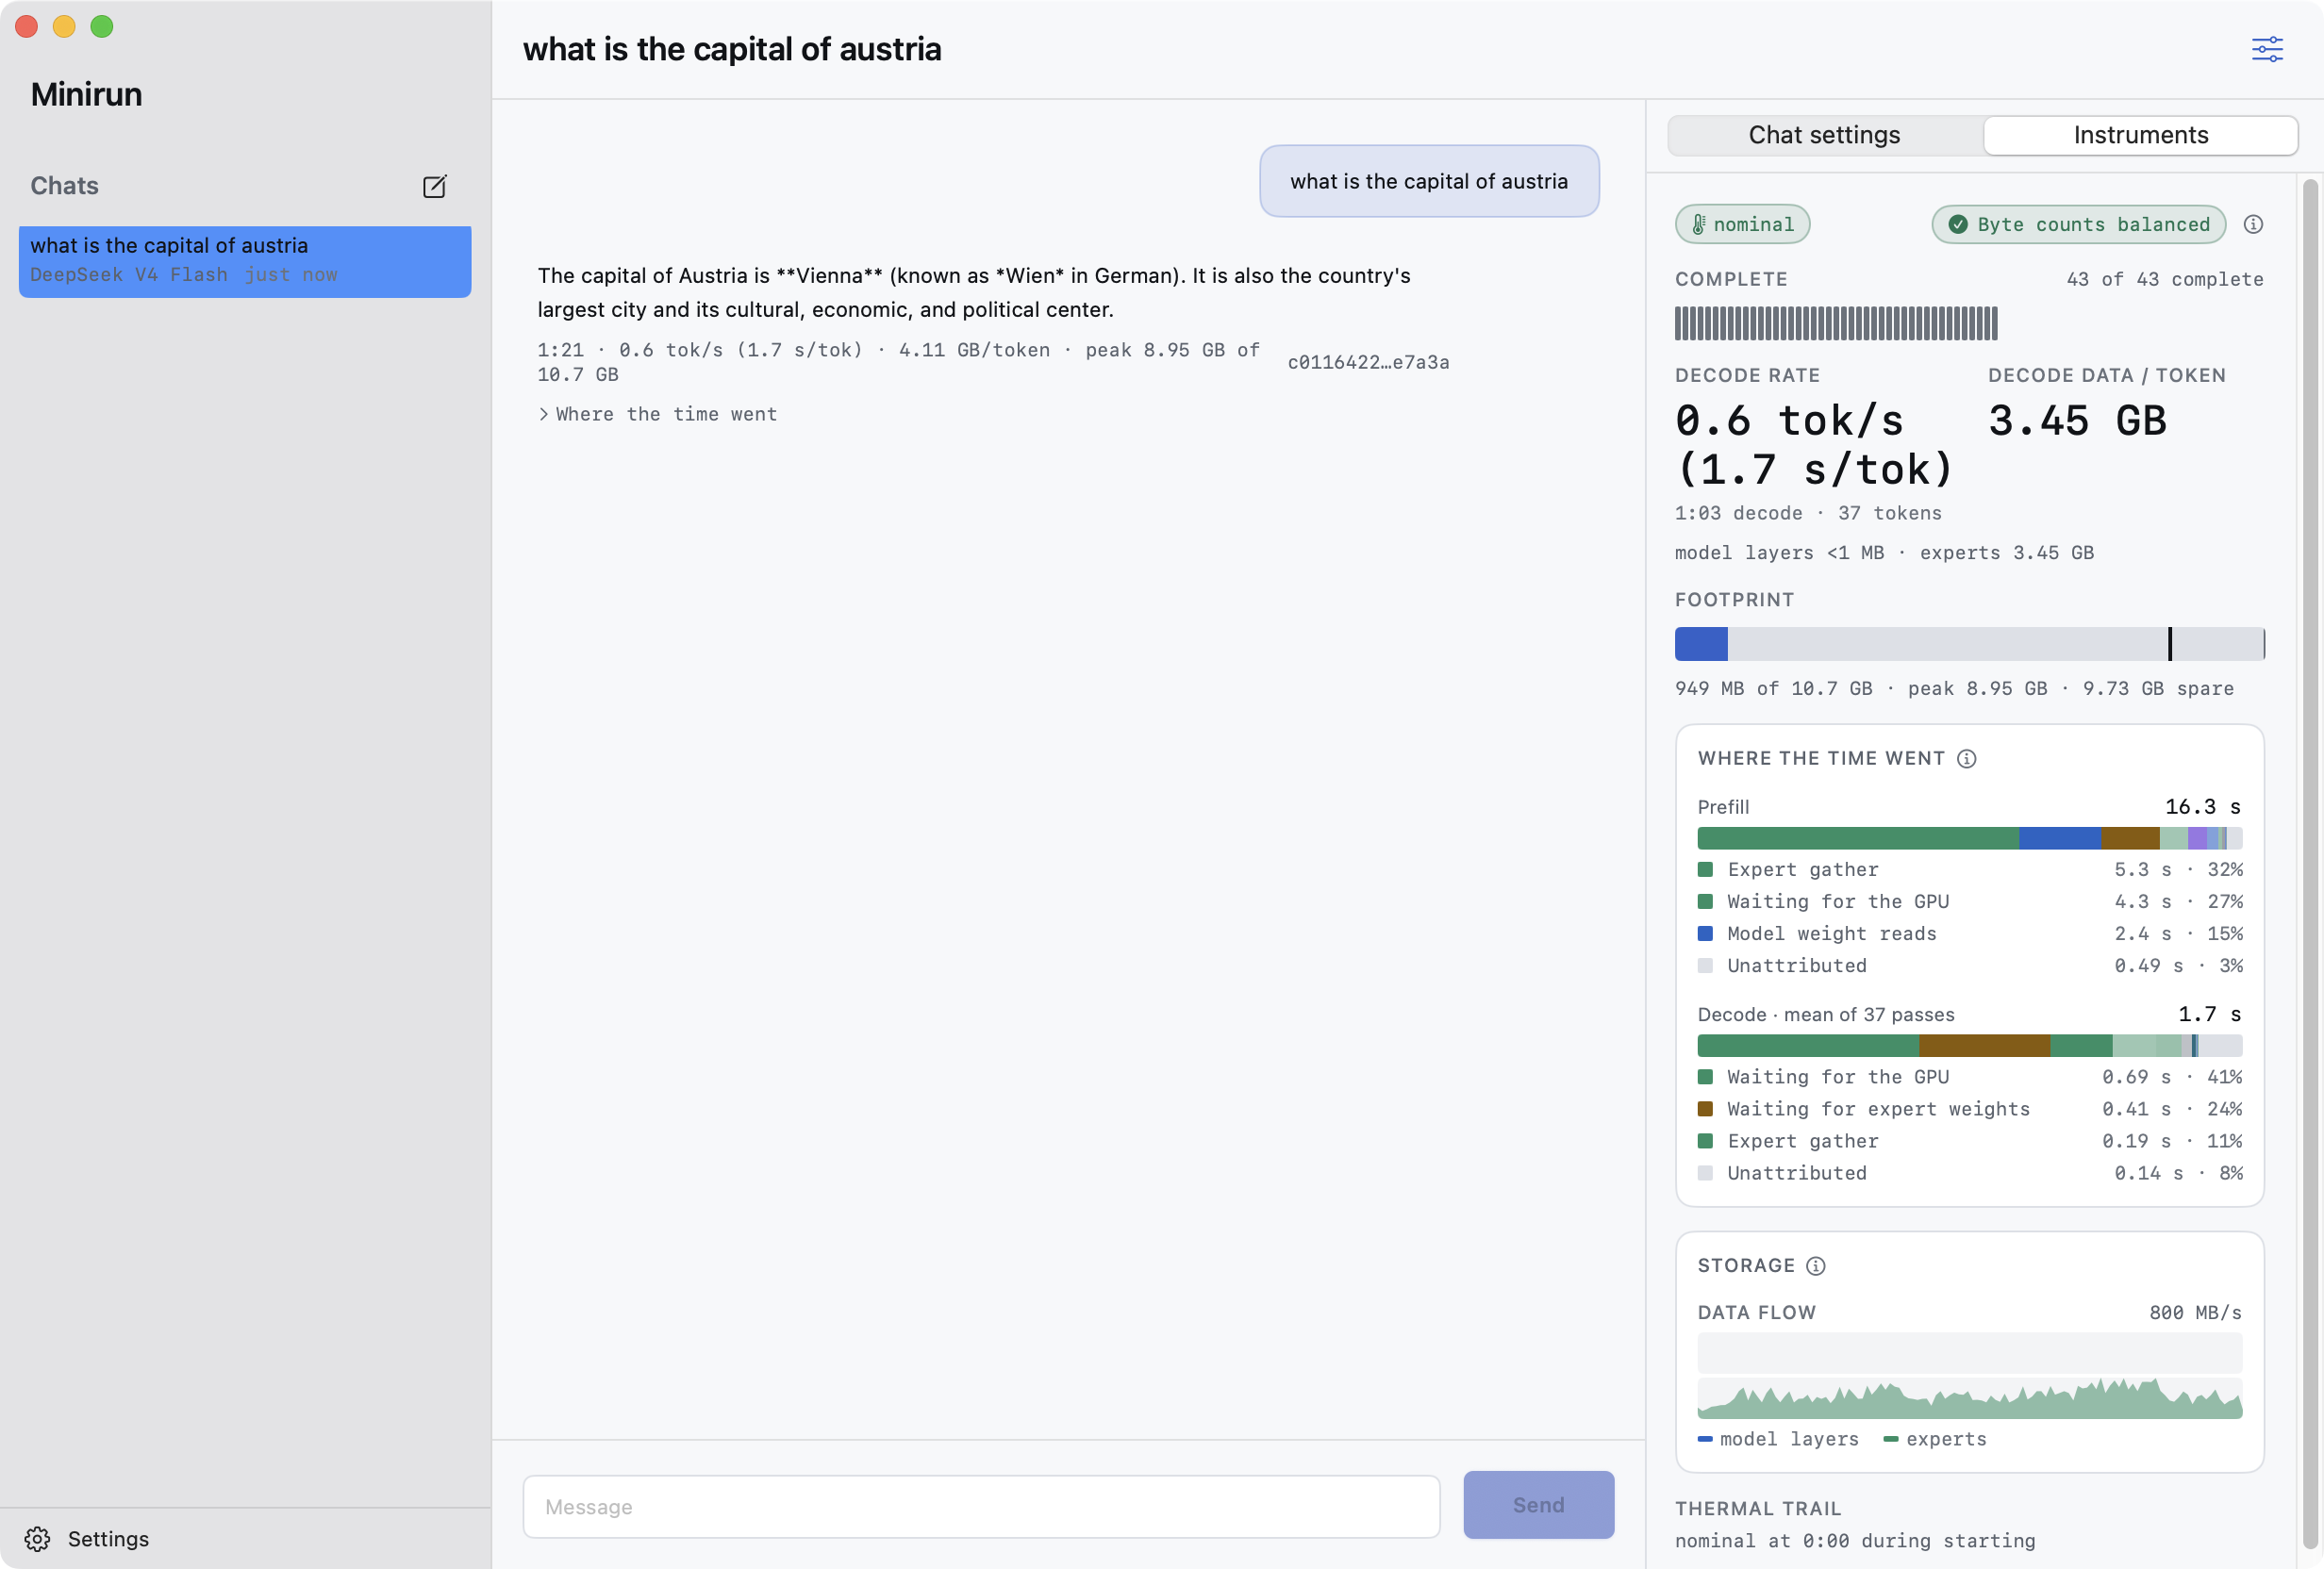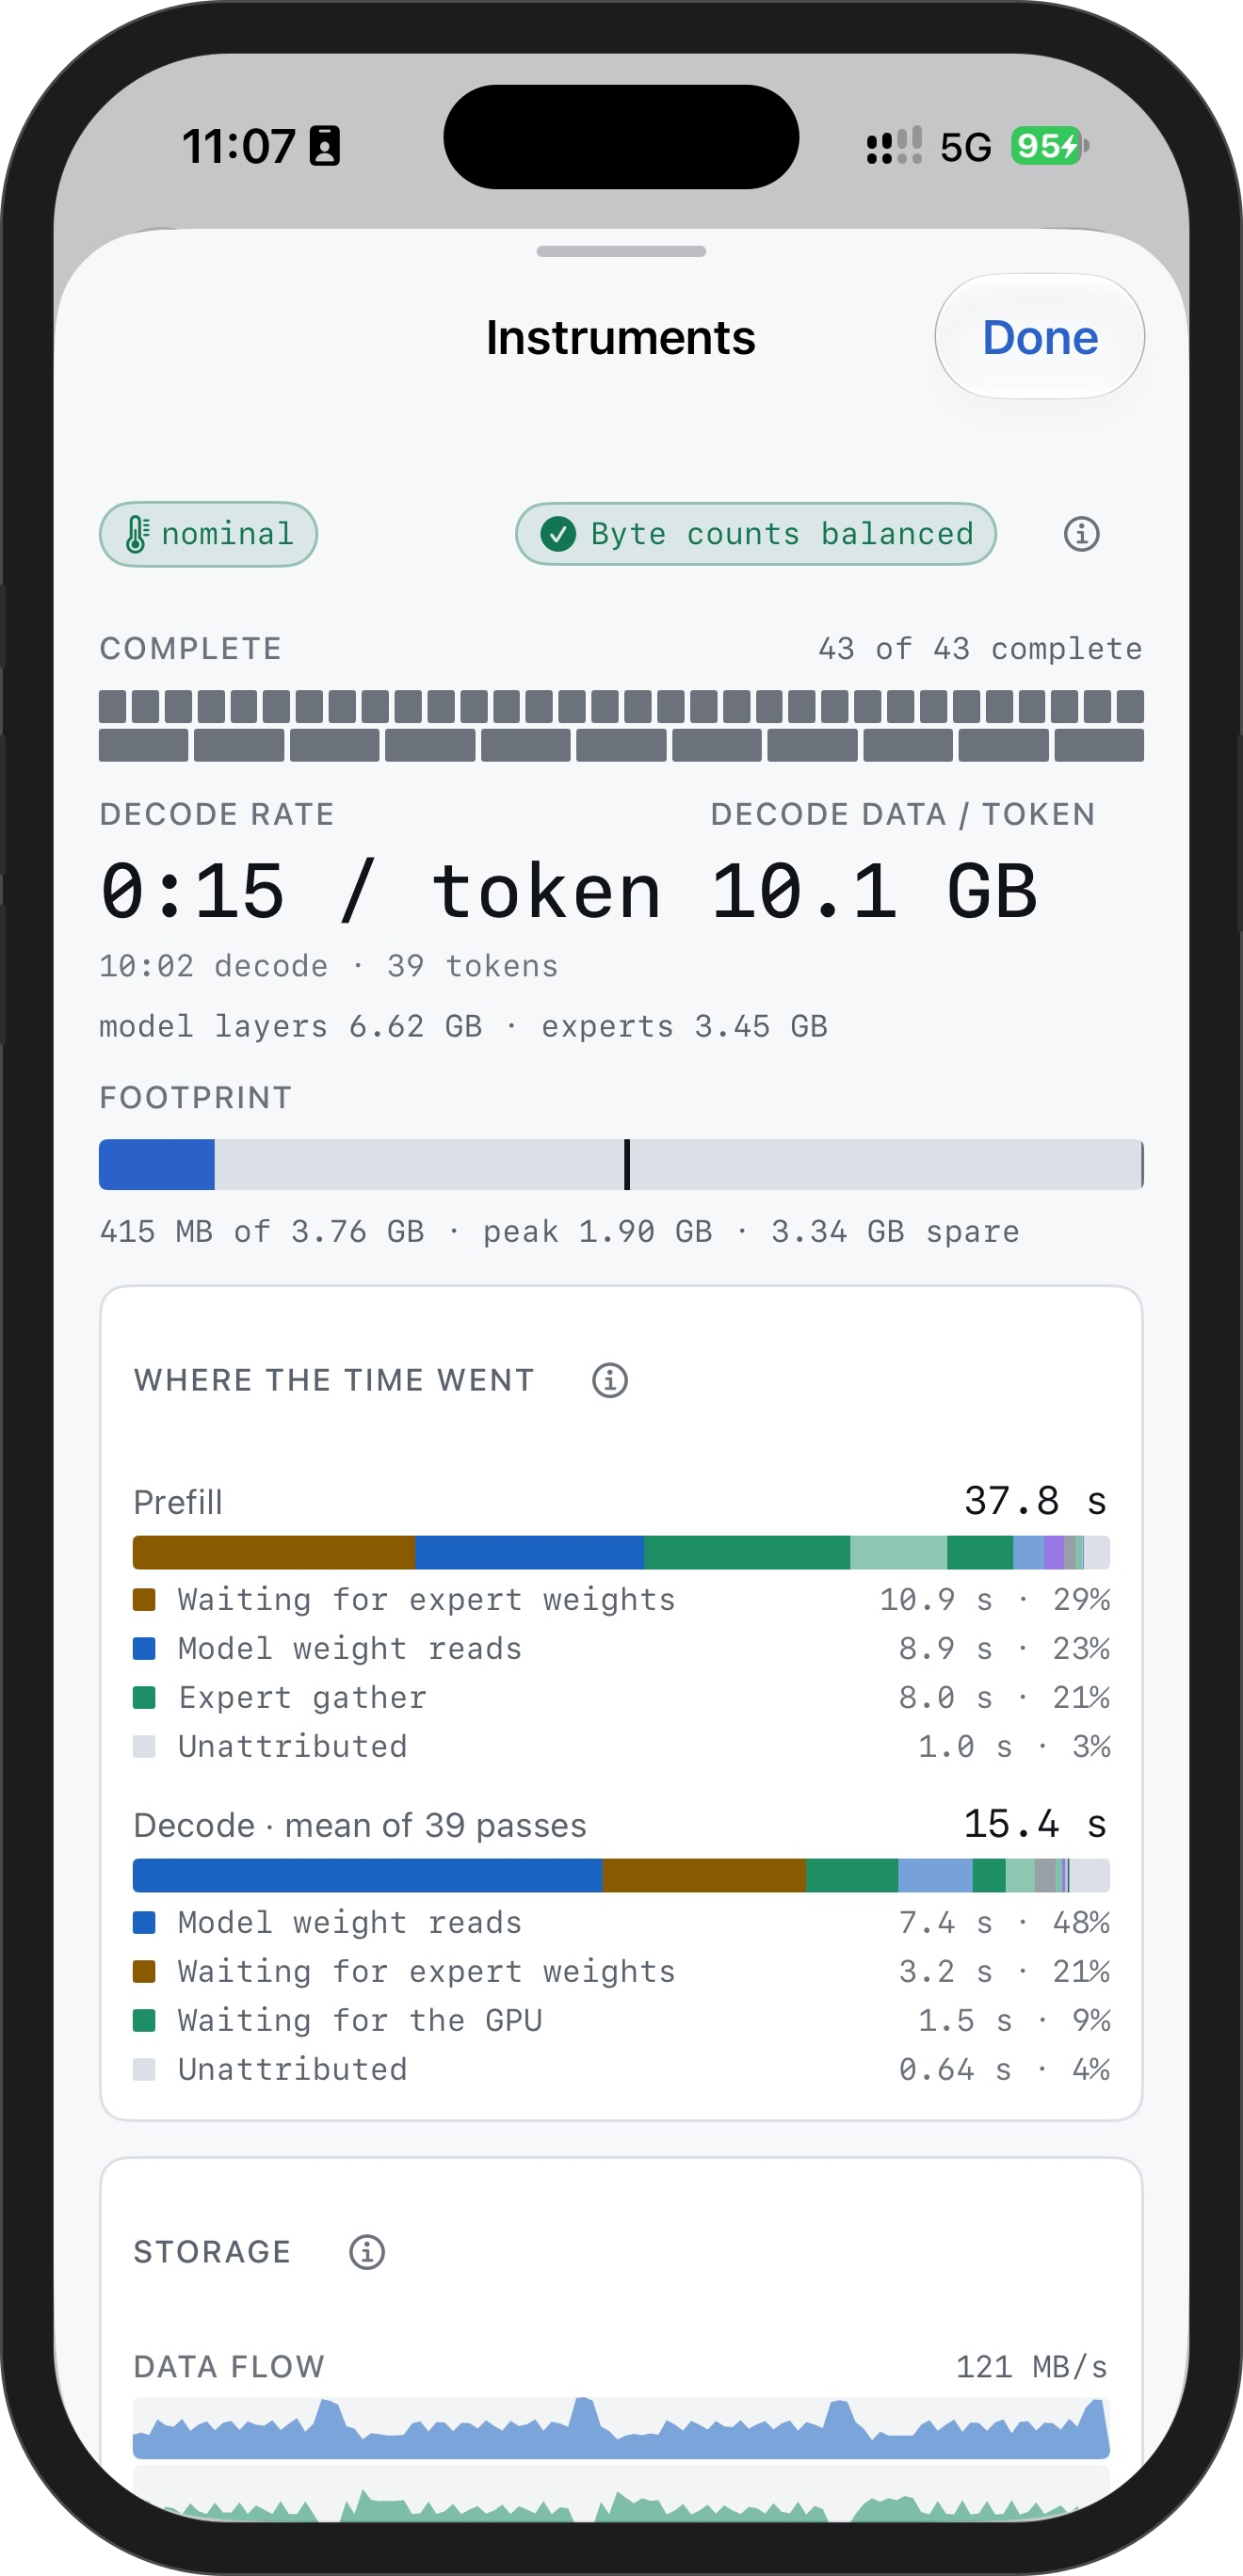
A live view of one run
Instruments sits beside the active conversation and reports what the selected runtime can measure during this run. It is not a benchmark dashboard and it does not predict performance from a model name. Values become available as the runtime crosses meaningful boundaries.
A dash, Waiting, or Not reported means the required evidence has not arrived. It must not be read as zero. Model-specific panels appear only when their runtime produces the corresponding evidence.
Stage, rate, and footprint
- Current stage
- The runtime's current model phase or layer boundary.
- Rate
- Generated tokens divided by the measured generation interval.
- Bytes per token
- Attributed storage reads for completed tokens plus the current in-progress token when reported.
- Footprint
- Current and peak run-owned memory relative to this conversation's budget, not total system memory.
- Layers
- Progress through the runtime's declared complete workload for the current stage.
Where the time went
This panel splits a pass into what it was waiting on, so a slow token reads as a cause rather than a number.
- Model weight reads
- Time spent reading the dense layer weights from the drive.
- Waiting for expert weights
- Time spent waiting for the experts the router picked, which cannot be read until routing has chosen them.
- Expert gather
- Time spent assembling the picked experts into the single buffer the pass computes against.
- Waiting for the GPU
- Time the pass spent in compute.
- Unattributed
- The remainder of the pass, which the runtime could not place in any of the categories above.
Byte flow and storage overlap
Byte flow is the measured read traffic attributed to model regions. A runtime may separate deterministic weights from routed-expert weights so you can see which part of the model is moving through storage.
Storage overlap estimates how much measured read time occurred inside useful compute intervals. It answers whether scheduled I/O was hidden behind computation; it is not the advertised link speed of the SSD and it is not meaningful before the runtime has reported both read and compute boundaries.
Model-specific cache signals
An expert-cache panel applies to routed models that report expert reads and retention decisions. Hits, misses, evictions, rejected inserts, and pinned entries describe that runtime's cache activity. A dense model or a runtime without those counters should omit the panel rather than display invented zeros.
Instruments during a run